
ConnectiLogs: understand what’s happening in your hosting
There are problems that make noise.
And then there are the others.
The ones that start silently.
⚠️ A strange access.
⚠️ A recurring error.
⚠️ A failed login attempt from an IP you don’t recognize.
⚠️ An email account with unexpected activity.
⚠️ A website that starts behaving «weird» without you knowing why.
Most of the time, the information you need to understand what’s happening is already there.
In the logs.
The problem is that finding and interpreting them is not always that simple.
Thousands of records, IPs, status codes, dates, requests, users, paths… Data designed to record everything that happens in a system, but not necessarily for you to quickly find the answer you’re looking for.
The problem is not having the data. It’s finding what really matters.
That’s why we have revamped ConnectiLogs.
Your logs already have the information, ConnectiLogs helps you find it
ConnectiLogs is cdmon’s tool for exploring and analyzing the activity of your services from a single place.
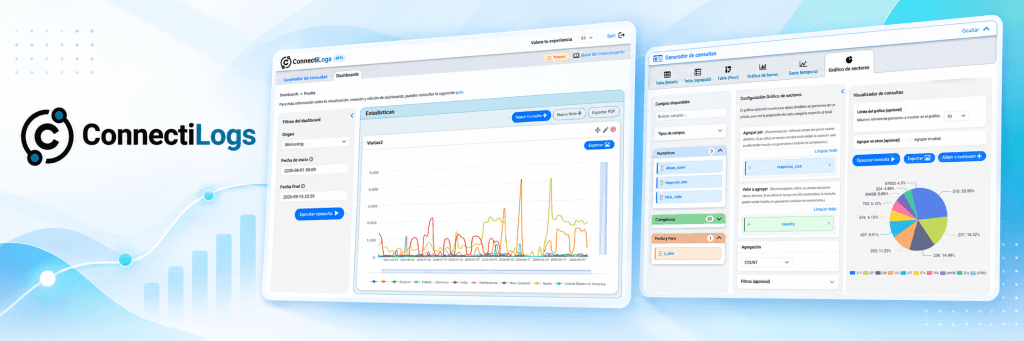
Instead of directly facing endless .log files, you can select what information you want to consult, explore the available data, apply filters, and decide how you want to visualize the results.
And all from a much more visual interface.
The difference is significant.
You no longer have to start by thinking:
«Where is the log I need?»
You can start with a much more natural question:
«What do I want to know?»
ConnectiLogs already helped you see what was happening in your services
ConnectiLogs is not new.
Until now, you could already use it to centralize and consult information about the activity of your services: access, email, malware, databases, and other relevant events.
A way to have much more visibility over what happens in your hosting and detect situations that might otherwise go unnoticed.
If you still don’t know all these possibilities, in our previous article about ConnectiLogs we tell you what information you can consult and how it can help you analyze the activity of your services.
Discover everything you can already do with ConnectiLogs
But having access to the information was just part of the challenge.
We wanted it to be much easier to explore, analyze, and adapt it to what you need to know.
And that’s where the new ConnectiLogs begins.
Now you decide what you want to search for and how you intend to see it
The new version of ConnectiLogs takes it a step further.
It’s no longer just about accessing the records and consulting the available information.
Now you can explore the data, build your own queries, apply filters, choose how to visualize the results, and create fully customized dashboards.
In other words, ConnectiLogs not only shows you what’s happening.
Now it gives you many more tools to investigate it.
From here, everything starts with a question:
What do you want to know?
Start with what you need to find out
Imagine your website is returning errors, and you want to investigate what’s happening.
Or you detect several failed access attempts and want to know where they are coming from.
Or you simply wish to check what activity has occurred in one of your services over the past few days.
ConnectiLogs organizes the records so you can start precisely from there.
When creating a query, the first thing is to select the data source through three levels:
Category: the area you want to analyze, such as web, email, or Control Panel.
Source: the specific service you would like to obtain information about, such as a domain, server, or user.
Collection: the specific records you aim to analyze, such as web activity, malware, or sessions.
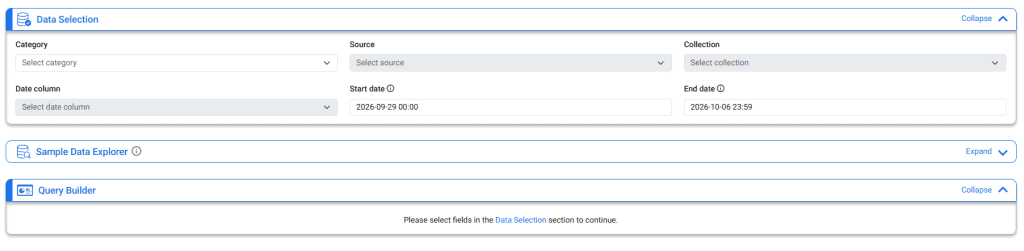
This way, you can narrow down from the start where you want to search without having to go through records that have nothing to do with what you need.
Learn how to create your own queries in ConnectiLogs
Don’t know exactly what to search for? Explore the data first
You won’t always enter ConnectiLogs knowing what field you need or how to build a query.
And that’s okay.
Before creating it, you can explore the data of a collection to understand what information it contains.
ConnectiLogs shows you a preview of the records and the different available fields. Additionally, you can hover over the columns to see a small description and understand what each data represents.
It’s especially useful the first time you work with a collection.
You can start by exploring, identify what information interests you, and from there, decide what you want to search for.
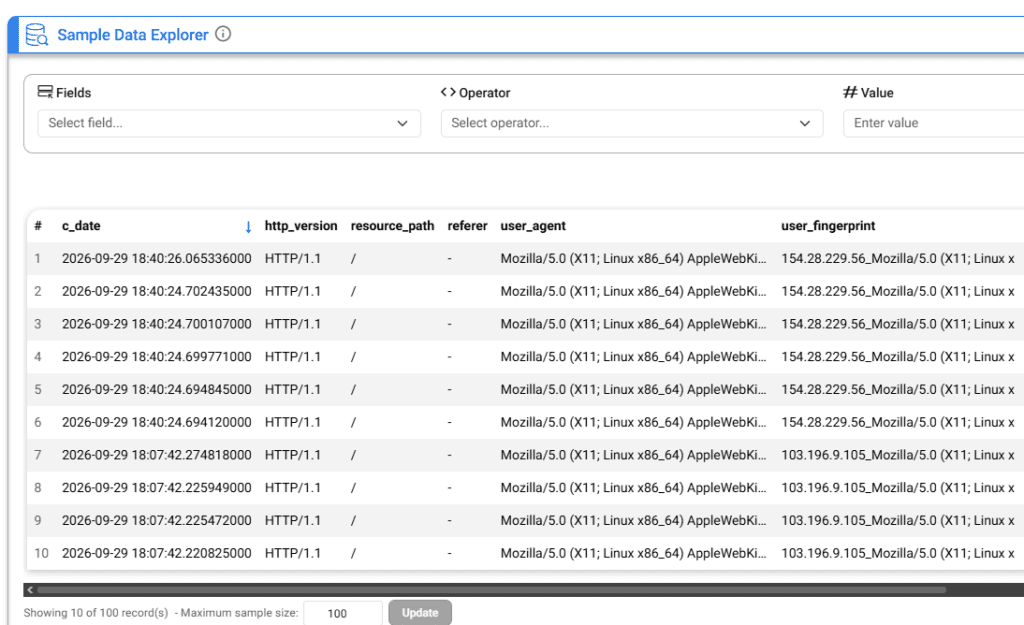
From this same exploration, you can also apply filters to narrow down the records and export the data in CSV if you would like to work with them outside ConnectiLogs.
From thousands of records to exactly what you’re looking for
This is where filters start to make a difference.
Suppose you want to investigate 500 errors on a website.
Instead of reviewing all its records one by one, you can tell ConnectiLogs:
Field: status code
Operator: =
Value: 500
And get only the records that have that status code.

You can also combine several filters.
For example:
status code = 500
domain = mydomain.com
In this way, the result is no longer «all records» or even «all 500 errors».
Now you are seeing the 500 errors of that specific domain.
Filters can be applied to fields like IP, domain, date, user, status code, and many others, depending on the records you are analyzing.
And you can search for exact matches, exclude certain values, work with partial matches, or combine different conditions.
You don’t need to learn a query language.
You need to know what you want to find.
Discover how to configure and combine filters in ConnectiLogs
Not all data is best understood in the same way
Finding the right records is just part of the job.
Sometimes you need to see the exact detail of each event.
Other times you want to know how many times something has been repeated.
And other times you simply need to see a chart to quickly detect a spike or a strange pattern.
That’s why ConnectiLogs allows you to visualize queries in different ways.
You can work with tables when you need to review specific records, use aggregated or dynamic tables to group and compare information, or transform the results into bar, line, area, or pie charts.
For example, imagine you have thousands of recorded accesses.
A table can help you investigate a specific IP.
But if you want to discover which IP is generating the most accesses, grouping the information and visualizing it can give you the answer much faster.
The same goes for the activity of a website. A chart can help you compare the most requested paths or see how certain activity evolves over time.
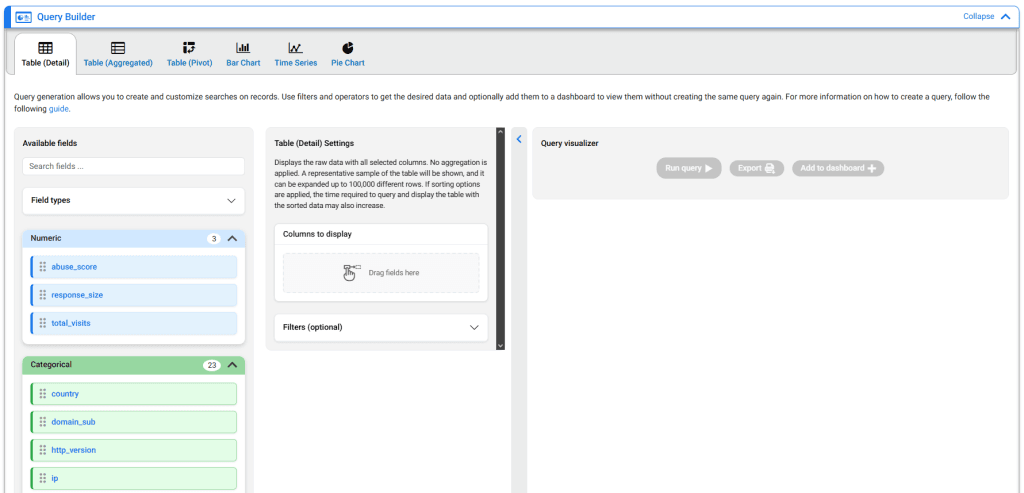
The idea is not to create charts just because.
It’s choosing the way to visualize the data that allows you to answer your question faster.
Save what’s important and create your own dashboards
There are queries you make once.
And there is information you want to have always located.
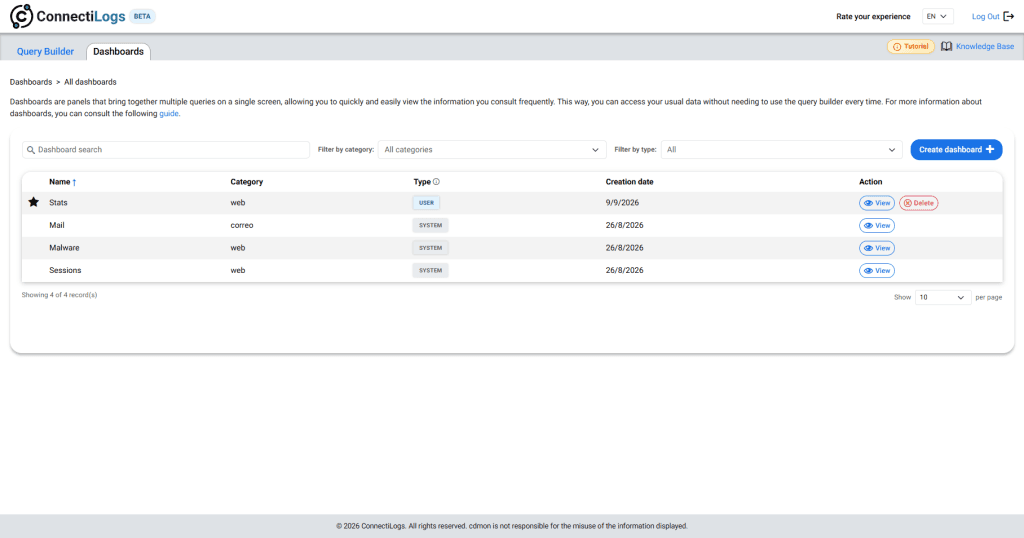
That’s what ConnectiLogs dashboards are for.
You can save the queries you’ve created and gather several of them in a single panel to quickly consult the information that interests you the most.
For example, you could create a dashboard to monitor the activity of your services and gather different visualizations related to access, errors, or relevant events.
Each dashboard can be adapted to what you need to analyze, and the queries can be displayed as tables or different types of charts.
So, when you want to review that information again, you won’t have to rebuild the analysis from scratch.
You will also find pre-prepared dashboards to directly consult certain types of activity without having to create your own queries.
Learn how to create and customize your dashboards
What can you investigate with ConnectiLogs?
So far, we’ve talked about how it works.
But the important thing is what you can do with all that information.
Why is my website failing?
Web activity logs allow you to investigate the requests your website receives.
You can use them, for example, to locate errors, analyze certain paths, or investigate specific activity within a period.
If you start detecting 500 errors, instead of just sticking with «something is failing,» you can filter the records and delve into what’s happening.
Discover how to analyze your website’s activity
Is someone trying to access one of my accounts?
An isolated failed attempt may not tell you much.
The same IP accumulating failed attempts on an account is another story.
With access logs, you can review both successful and failed connections and delve into information like IP, country, or connection type.
This can help you detect patterns that deserve a review.
You can also consult access to the Control Panel itself or analyze MariaDB user logins to investigate activity you don’t recognize.
Check how to analyze access to your email accounts (available only in Spanish)
Has malware been detected on any of my hostings?
When the security system detects potentially malicious code, ConnectiLogs allows you to consult those detections and delve into the available information about the affected files.
You can investigate which file has been detected, where it is located, what threat has been identified, and when the detection occurred.
It doesn’t replace your hosting’s security measures.
It gives you something equally important when you need to investigate: visibility over what has been detected.
Discover how to consult malware detections in ConnectiLogs
What’s happening with my email?
ConnectiLogs also centralizes information related to email activity.
You can consult access to accounts and detect successful or failed attempts, review from which IP and country they occurred, and check the type of connection used.
You can also consult information related to email authentication to review your domains’ configuration.
Check how to review your domains’ email authentication (available only in Spanish)
ConnectiLogs adapts to what you need to know
Not everyone enters ConnectiLogs looking for the same thing.
If you manage a single website, it can help you investigate an error or understand an activity you don’t recognize.
If you manage several projects, you can use dashboards to gather the information you need to consult regularly.
And if you’re a developer, system administrator, or need to delve deeper, you can build more specific queries, combine filters, and work directly with the records that interest you.
You don’t need to use all the possibilities of ConnectiLogs.
Only those that help you find the answer you’re looking for.
Start exploring your data
ConnectiLogs is directly integrated into your cdmon Control Panel.
You don’t need to install external tools or manually import your services’ logs.
Access your Control Panel, and you’ll find ConnectiLogs in the top bar.
From there, you can use the available dashboards or start exploring the data and create your own queries.
Because your services were already generating all this information.
Now you have a much easier way to find what you need and understand what’s happening.
Want to delve deeper? We help you get started
These are just some of the possibilities of ConnectiLogs. If you want to delve into a specific functionality or discover everything you can consult from the tool, we have gathered all the documentation in our Help Center.

By: Marina Moreno
She works on cdmon's marketing team, creating content that helps businesses, professionals, and creators better understand the world of hosting, domains, and online presence. She is especially interested in how artificial intelligence, search engines, and digital communication are evolving, and enjoys translating technical concepts into language that anyone can understand.
You can learn more about her background on LinkedIn


